


NASA’s CASI: Building Climate-Resilient NASA Centers
National Aeronautics and Space Administration (NASA) Centers are currently experiencing heavy downpours, heatwaves and coastal flooding, and these are expected to increase in the coming decades due to climate variability and change. The United States Global Change Research Program (USGCRP) 2009 Climate Impacts Report concluded that “human-induced climate change is happening now, the impacts are already apparent, and greater impacts are projected, particularly if [greenhouse] gas emissions continue unabated.”
Later in 2009, President Obama issued Executive Order 13514, titled “Federal Leadership in Environmental, Energy and Economic Performance,” which mandates that all agencies “evaluate agency climate-change risks and vulnerabilities to manage the effects of climate change on the agency’s operations and mission in both the short– and long-term.1 ” NASA is responding to this mandate through an approach that brings its scientists and operational stewards together to investigate and to manage climate risks.
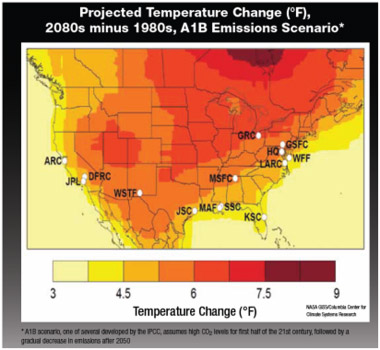
Fig. 1 – Photo Credit: NASA
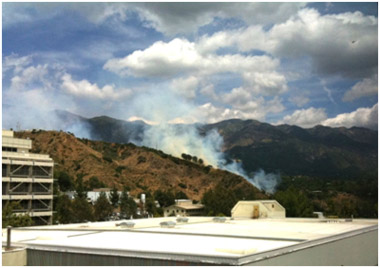
Fig. 2 – Photo Credit: NASA
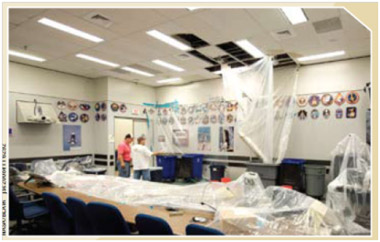
Fig. 3 – Photo Credit: NASA
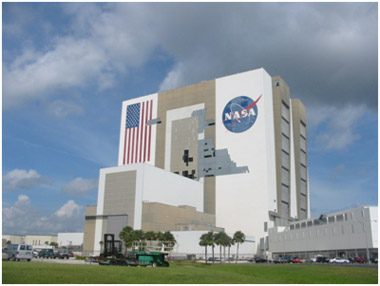
Fig. 4 – Photo Credit: NASA
Climate extremes and variability pose a range of hazards to NASA Centers and facilities throughout the U.S (Fig. 1). During 2011 alone, NASA Centers have been affected by tornados, flooding and wildfires. The tornado outbreak of April 27 in Mississippi and Alabama, in addition to killing more than 300 people, led to the closing of Marshall Space Center for 11 days as the Huntsville region dealt with power outages and widespread damage. NASA’s Jet Propulsion Lab in California has experienced both extreme flooding and wildfires during the past year (Fig. 2). Hurricane Irene in August 2011 produced a large storm surge near Langley Research Center in Virginia, although the Center was spared significant damage.
In recent years the effects of other hurricanes on NASA Centers have been more substantial. Hurricane Ike in 2008 caused flood and wind damage at the Johnson Space Center in Texas (Fig. 3), with approximately three-quarters of all roofs sustaining at least minor damage (NASA, 2008). Hurricane Frances in 2004 caused damage to the large Vehicle Assembly Building and other facilities at NASA Kennedy Space Center – KSC (Fig. 4). In the aftermath of the devastation associated with Hurricane Katrina in 2005, many displaced local residents turned to the Michoud Assembly Facility in Louisiana as a safe haven.
Future climate hazards at NASA Centers and facilities are likely to include more frequent and extreme heat events, sea level rise and exacerbated coastal flooding, more extreme precipitation events and changes in water availability. These changing climate hazards may adversely affect NASA missions and operations by damaging critical infrastructure while threatening human and natural resources. Specific mission-related vulnerabilities could include: launch capabilities, space operations, ground systems, and training and test facilities due to such impacts as shifting reliability and increasing water and energy costs, and changes in safety and operations related to extreme events, such as wildfire and floods.
By developing climate adaptation strategies tailored to the specific risks and impacts anticipated, NASA decision-makers are able to minimize negative effects of climate extremes and climate change while leveraging positive outcomes. For example, at the Goddard Space Flight Center in Greenbelt, Maryland, impervious surfaces are being replaced with natural vegetation and porous pavement to reduce flooding and to manage stormwater.
Because effective risk management requires the best possible understanding of hazards, NASA organized the Climate Adaptation Science Investigator Work Group (CASI) to expand collaboration among its Earth scientists, applications researchers and institutional stewards. The collaborative approach is captured in CASI’s mission statement: “To advance and apply NASA’s scientific expertise and products to develop climate adaptation strategies that support NASA’s overall mission by minimizing risks to each center’s operations, physical and biological assets and personnel.”
While CASI is principally a science effort, its foundation rests on partnering with representatives from many Center organizations, including infrastructure, environmental management, master planning, human resources, and emergency planning and response, all working together to disseminate and to use climate science knowledge tailored to enable development of center-specific adaptation solutions.
CASI Activities
CASI is supported by funding from NASA’s Earth Science Division and Applied Sciences Program, and is led by Cynthia Rosenzweig, Ph.D., of NASA’s Goddard Institute for Space Studies (GISS). The team at GISS interacts with a lead CASI scientist at eight NASA Centers. Together the team has engaged in a range of activities since CASI’s launch in the summer of 2010 including:
- Downscaling2 Center-specific climate hazard information and projections,
- Conducting climate research customized to each Center’s needs,
- Building inventories of each Center’s existing climate and impact data and research activities, and
- Co-leading adaptation workshops.
1.) Center-Specific Climate Information
Downscaled regional climate projections were generated for each NASA Center based on a combination of observed data and climate model simulations. Sixteen coupled global climate models (GCMs), which mathematically represent the evolution of the climate system, including the coupling of the ocean, atmosphere, land and ice, were used to sample a range of possible responses to greenhouse gases and aerosols.
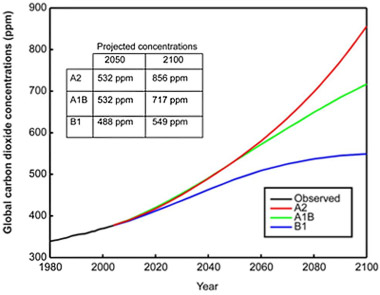
Fig. 5 – Source: IPCC Special Report on Emissions Scenarios (SRES), 2000
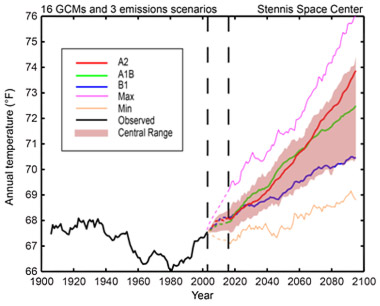
Fig. 6 – Observed data are from Poplarville, Mississippi
Because current-generation GCMs do not resolve areas smaller than approximately 10,000 km22, techniques such as statistical downscaling and bias correction are used to better resolve the spatial scales of relevance to decision makers. The CASI team used the Bias-corrected and Spatially-Disaggregated (BCSD) Climate Projections at 1/8 degree (approximately ~12 km) resolution for the continental United States derived from the World Climate Research Programme’s (WCRP’s) Coupled Model Intercomparison Project phase 3 (CMIP3). This multi-model dataset is available at: http://gdo-dcp.ucllnl.org/downscaled_cmip3_projections/ (Maurer et al., 2007). The outputs from this product, which provide monthly results at 1/8 degree spatial resolution, were further downscaled using observed daily data from a reliable weather station near each NASA Center. This additional downscaling allows for projections of changes in extreme events, such as additional heat waves and fewer cold events.
Climate uncertainty associated with future concentration of greenhouse gases and aerosols was addressed by use of three different scenarios of greenhouse gas emissions and aerosol concentrations scenarios: high (A2), medium (A1B) and low (B1), representing various population, economic and technology pathways (Fig. 5) (Nakicenovic, 2000). During the decade since the development of these scenarios, actual greenhouse gas emissions have generally been as high or higher than projected under any of them (Le Quere, 2009).
Using historical data, downscaled climate model outputs and greenhouse gas emissions scenarios, the CASI team has developed climate products for each of NASA’s Centers and facilities. Core climate products include analysis of: 1.) historical trends and variability, 2.) projected changes in mean temperature (Fig. 6), precipitation and sea level and 3.) quantitative and qualitative projections for extreme events (Table 1).
| Baseline | 2020s | 2050s | 2080s | |
|---|---|---|---|---|
| Days with maximum temperature at or above 90 | 28 | 31 (34 to 45) 55 | 37 (46 to 65) 82 | 42 (55 to 89) 101 |
| Days with maximum temperature at or above 100 | 0.3 | 0.3 (0.5 to 1) 4 | 0.6 (1 to 6) 14 | 1 (3 to 15) 33 |
| Days with minimum temperature at or below 40 | 163 | 138 (141 to 148) 152 | 116 (129 to 141) 146 | 96 (112 to 135) 141 |
| Days with minimum temperature at or below 32 | 110 | 75 (85 to 94) 97 | 55 (71 to 84) 94 | 40 (56 to 76) 87 |
| Table 1. Extreme event projections for Goddard Space Flight Center. Observed data are for Beltsville, Maryland. The baseline data for temperature and precipitation represent 30 years centered around the 1980s. Shown are the minimum, central range (middle 67%) and maximum of values from model-based probabilities across 16 GCMs and 3 greenhouse gas emissions scenarios. | ||||
2.) Customized Research
Each Center faces unique climate hazards and impacts. The following list describes the major research accomplishments at each Center during the first phase of the effort:
- Ames Research Center (ARC) – Analyzed historical and projected climate and land use change for surrounding region; linked projected changes to increased drought and flood risk, sea level rise and to declines in ecosystem services; hosted Resilience & Adaptation to Climate Risks Workshop and a Climate Symposium open to the general public;
- Dryden Flight Research Center (DFRC) – Developed a vulnerability assessment based on an extreme precipitation scenario known as ARkStorm; hosted Workshop on Climate Change Adaptation in the Mojave Region;
- Goddard Space Flight Center (GSFC) – Researched impacts of climate change on forest health by merging NASA ecosystem modeling (Biome-BGC) and forest modeling (UFORE-iTree);
- Jet Propulsion Laboratory (JPL) – Analyzed the relative importance of natural variability (including the El Niño Southern Oscillation) and long-term trends in California’s long-term precipitation records;
- Kennedy Space Center (KSC) – Completed a GIS analysis of sea level rise hazards to identify first-order vulnerabilities of more than 25 different facility, infrastructure, and natural and archaeological resource categories; hosted a Resilience & Adaptation to Climate Risks Workshop;
- Langley Research Center (LaRC) – Applied the Virginia Institute of Marine Science (VIMS) storm surge model to the geographic location of LaRC and adjacent Langley Air Force Base; hosted a Resilience & Adaptation to Climate Risks Workshop;
- Marshall Space Flight Center (MSFC) – Assessed the impacts of climate and extreme weather on the Center’s buildings and infrastructure; installed local weather stations to identify and to characterize extreme events at fine spatial scales;
- Stennis Space Center (SSC) – Developed baseline storm-surge inundation scenarios and investigated available storm surge models.
3.) Inventories of Climate and Impact Data and Research and Adaptation Activities
CASI scientists have conducted an inventory of the climate and impact data, models, research and projects relevant to each Center and its surrounding region. This inventory is grounded in NASA’s vast array of satellite and earth-based monitoring data. These data sets provide information about trends and variability in earth’s climate (e.g., planetary energy balance; Fig. 8) and weather (e.g., tropical cyclones). Remotely sensed data also contribute to our understanding of how climate and other stressors are impacting earth systems, such as biomes (e.g., forest health), agriculture (e.g., crop yields), oceans and coasts (e.g., phytoplankton productivity), and atmospheric composition (e.g., air pollution). Another key NASA activity is dynamic simulation of Earth’s climate system, through use of such products as the NASA GISS Global Climate Model (GCM) (Schmidt et al, 2006).
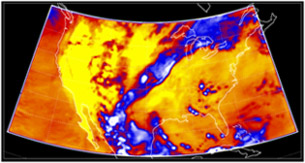
Fig. 8 – Photo Credit: NASA; Instrument: CERES/Aqua
Outgoing Longwave Radiation on August 2, 2006 over the United States during the Oppressive Summer Heat Wave of 2006.
In addition to these products, the CASI team is identifying baseline information about each Center (e.g., how critical infrastructure has historically been affected by extreme weather) and the surrounding communities (e.g., adaptation assessments that are underway or planned). Products identified through the CASI inventories can be used to reduce uncertainties associated with climate and climate impacts while facilitating collaboration in adaptation with communities that surround NASA centers.
4.) Co-Leading Adaptation Workshops
The CASI Team co-leads Resilience and Adaptation to Climate Risks Workshops with members of NASA’s Office of Strategic Infrastructure. The purpose of these three-day workshops is to: 1.) share climate information (historic, current and projected) specific to the Center’s region both internally and with community neighbors; 2.) characterize the risk of current and future climate on the Center’s assets and capabilities; 3.) begin to develop climate adaptation strategies and to understand how to integrate these strategies, as well as climate information, into existing management plans and processes; 4.) identify future research needs and 5.) start to coordinate activities with master planners, facilities and environmental managers, and regional stakeholders who participate in the workshops.
These site-specific Resilience and Adaptation to Climate Risks workshops, comprising both plenary and breakout sessions are built around an 8-step adaptation assessment framework first applied in New York City by the New York City Panel on Climate Change, which has been modified for consistency with NASA needs (NPCC, 2010). To date, workshops have been held at Kennedy Space Center (May 2010), Ames Research Center (February 2011) and Langley Research Center (September 2011).
What’s Next for CASI
Targeted research continues to be developed to address both specific Center vulnerabilities and needs, and to expand CASI’s spatial scope to larger regions. During the next year, the CASI team will evaluate and use for Center research: 1.) Retscreen (Renewable Energy Screen) Monitoring, Targeting and Verification Tool (MTVT; http://www.retscreen.net), an interactive program that can incorporate weather and climate information into buildings’ energy conservation; 2.) remote sensing and modeling of Center impacts using the Terrestrial Observation and Prediction System (TOPS; http://ecocast.arc.nasa.gov/) modeling system and 3.) storm surge modeling under various sea level rise scenarios.
CASI collaboration and outreach will also be expanded during the next year. CASI science results will be presented at the American Geophysical Union annual meeting in San Francisco in December 2011 and, for the second consecutive year, CASI will present at the Environment, Energy Security and Sustainability Symposium (E2S2) in New Orleans in May 2012. CASI presentations will also be given to other agencies engaged in climate assessment and adaptation. These efforts, which are aligned with activities such as the National Climate Assessment (globalchange.gov) and the Council on Environmental Quality’s Climate Change Adaptation Task Force (whitehouse.gov/administration/eop/ceq/), will encourage effective coordination across agencies and help ensure that key takeaways from NASA’s unique partnership between its research and operational arms are shared with as broad an audience as possible.
Acknowledgements: The authors wish to thank Jack Kaye and Lawrence Friedl of NASA Earth Sciences Division for their stewardship and support of CASI. The authors also wish to thank Olga Dominguez and James Leatherwood from NASA’s Office of Strategic Infrastructure for their pioneering efforts in building partnerships between NASA’s science and stewardship communities. Finally, the authors thank the CASI Center scientists for bringing CASI to life at each NASA Center.
Ph.D. and Lead CASI Scientist
Global Challenges


