


The Past as Guide to the Future: US Geological Records of Sea-Level Change
Sea-level rise is one of the more certain impacts of future climate change; although, uncertainty surrounds its likely global and regional magnitude. Mitigation of greenhouse gas emissions is an unlikely prospect; therefore, people must be prepared to adapt to rising sea levels and shifting coastlines. Military infrastructure, coastal populations and natural ecosystems are all at risk from future changes in sea level. To improve predictions of sea-level change and how the U.S. coastline will respond to them, stakeholders must better understand changes that occurred in the past. With this in mind, the authors produced a new, comprehensive sea-level history for the U.S. Atlantic coast from a database of geological reconstructions spanning the last 12,000 years. It reveals (1) significant spatial variability caused by vertical land motion from an extinct ice sheet and (2) a higher rate of sea-level rise during the 20th Century (measured by instruments) than longer term background rates determined from geological data.
Why Did Sea Level Change in the Past?
Relative sea level (RSL) is the net result of ocean volume changes and vertical land motion. Alterations in both or either of these contributions cause spatial and temporal variability of RSL. Changes in ocean volume are principally caused by exchange of mass between the land (ice sheets) and ocean but are also a product of ocean water density and gravitational effects. Since the peak of the last glaciation (approximately 26,000 to 21,000 years ago), 50 million km3 of ice melted from land-based ice sheets, thus raising RSL in tropical regions distant from the former ice sheets by ~120 m. As water melted from continental ice sheets and flowed into the global ocean, sea-level rise averaged 10 mm/year but peaked as high as 50 mm/year. The input of meltwater slowed significantly and ended ~4000 years ago with the final demise of the North American and Northwest European ice sheets. Since then RSL change along the U.S. Atlantic coast has been driven by movement of the land.
Vertical land motion on tectonically stable coastlines is the product of glacial isostatic adjustment (GIA) – a process that modifies Earth’s shape as the continents are loaded and unloaded by large ice sheets. As an ice sheet grows, the additional mass is compensated for by subsidence beneath the ice mass and the outward flow of mantle material to uplift a peripheral bulge around the ice margin. During deglaciation, as loading is diminished, land underneath the thinning ice sheet uplifts, and the peripheral bulge subsides. The effects of GIA are ongoing, even after the ice sheets are gone, because the solid Earth has a relaxation time on the order of several thousand years. In North America areas formerly glaciated by the Laurentide Ice Sheet continue even today to experience land uplift of more than 8 mm/year while much of the U.S. Atlantic coast is currently subsiding due to collapse of the forebulge (Figure 1A). The authors use geological data to calculate the ongoing rate of subsidence.
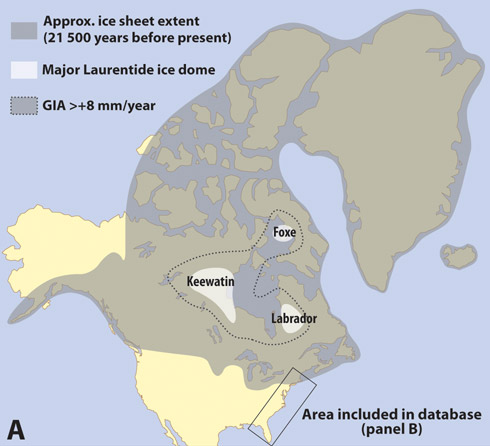
Figure 1A | All Figures Courtesy of Engelhart, S.E., Horton, B.P. and Kemp, A.C.
Approximate extent of Laurentide and Greenland ice sheets at 21,500 years ago. Three principal ice domes (where ice was thickest) of the Laurentide ice sheet are shown, as well as areas currently experiencing glacio isostatic adjustment (uplift) in excess of 8 mm/year. Regions along the U.S. Atlantic coast analyzed in this work approximate a gradient of distance from the ice sheet.
Geological Indicators of Relative Sea Level
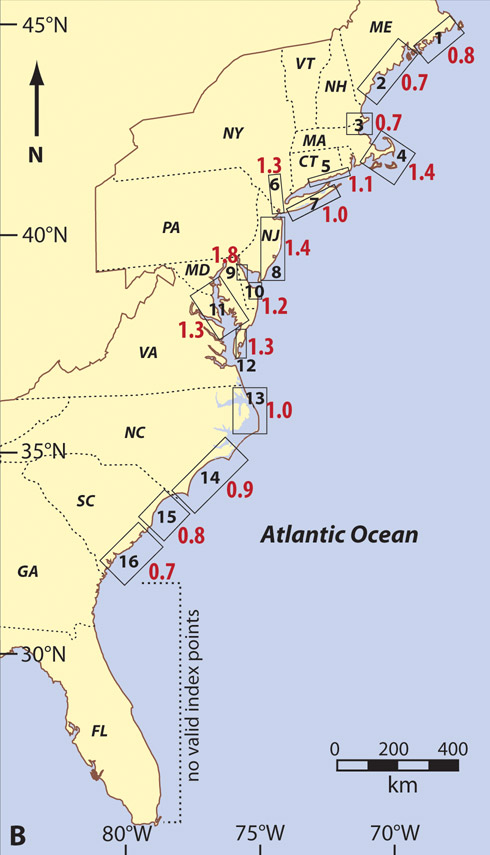
Figure 1B
The U.S. Atlantic coast has been the focus of studies that aim to reconstruct RSL for more than 50 years. The authors used this wealth of records to create a comprehensive and standardized database of past sea-level changes. They interpreted the macro- (e.g.plant remains) and microfossils (e.g. foraminifera, diatoms, pollen) contained within sediment collected from coastal wetlands to identify the environment in which they were deposited (e.g. salt marsh, freshwater marsh, forest). Sample age was determined by radiocarbon dating the organic remains of plants and animals. More than 70 fields of data were collected for each sample in the database, including information regarding tidal parameters and sediment compaction. The authors developed more than 800 data points that estimate the position of RSL during the last ~12,000 years (the Holocene) that are referred to as sea-level index points. The database spans the coastline from Maine to South Carolina and is grouped into 16 geographical regions. No valid sea-level index points were available for Georgia or Florida (Figure 1B).
Figure 1B Caption – Location of the 16 regions (black numbers and boxes) from which sea-level index points were grouped for analysis. Number in red indicates the late Holocene (4,000 years ago to AD 1900) background rate of relative sea-level rise in mm/year for each region.
Relative Sea Level Data from the U.S. Atlantic Coast
A general pattern emerges from the database of greatest rates of RSL change during the early Holocene. This is due to a combination of ice melt and vertical land motion decreasing in magnitude over time. This is illustrated in New York (region 6) where RSL rose from -11 m at 6,000 years ago to -6 m at 4,000 years ago, a rate of 2.5 mm/year. This rate decreased to 1.3 mm/year from 4,000 years ago to AD 1900. The general absence of RSL data prior to 6,000 years ago, when RSL rates were similar to those expected in the 21st Century, may warn of the inability of coastal ecosystems to keep pace with future changes.
RSL histories (Click here for Figure 2) in areas glaciated during the last glacial maximum (regions 1-7) were dominated by ice unloading, which is exemplified by the Holocene record for southern Maine (region 1). Geological data suggested a RSL change from falling to rapidly rising sea-level (3.5 mm/year) at 7,000 years ago. In areas south of Long Island (regions 8-16), the RSL reconstructions record the continuous collapse of the peripheral bulge since the last glacial maximum. The mid-Atlantic coast experiences the highest rates of land subsidence. Rates in the Inner Delaware (region 9) decreased from 5.5 mm/year between 6,000 and 4,000 years ago to 1.7 mm/year from 4000 years ago to 1900 AD. Moving south the rate of land subsidence reduces in magnitude. For example, in southern South Carolina (region 16) RSL rose by 0.7 mm/year from 7,000 to 1900 AD.
20th Century Changes in Relative Sea Level
Ongoing vertical land movement from GIA also contributes to rates of sea-level rise measured by tide gauges and hinders comparisons among regions. For example, U.S. Atlantic coast tide gauges record a 20th Century rate of rise that is apparently double the global average of 1.7 mm/year, but this contrast is unfair unless instrumental records are amended to remove the GIA contribution. We used linear regressions fitted through regional RSL reconstructions for the last 4000 years as an estimate of GIA and assumed that ocean volume was constant during this period until AD 1900. Our analysis reveals that the major driver of spatial variation in rates of sea-level rise observed today along the U.S. Altantic coast is these background rates of GIA (Figure 3). Rates of GIA are less than 0.9 mm/year in Maine and New Hampshire but increasing to greater than 1.0 mm/year in Massachusetts, Connecticut and New York. Maximum rates of GIA induced land subsidence are centered on the mid-Atlantic in New Jersey, Delaware, Maryland and Virginia (1.2 to 1.8 mm/year). Rates decrease to less than 1.0 mm/yr in North and South Carolina. Although no sea level index points were generated for Georgia and Florida, the rate of GIA is likely to continue to decrease and be less than 0.7 mm/year (the rate in the southern part of South Carolina).
If there had been no additional sea-level rise from ocean volume changes during the 20th Century, then rates of rise measured by tide gauges would equal these background rates; the reality is quite different (Figure 3).
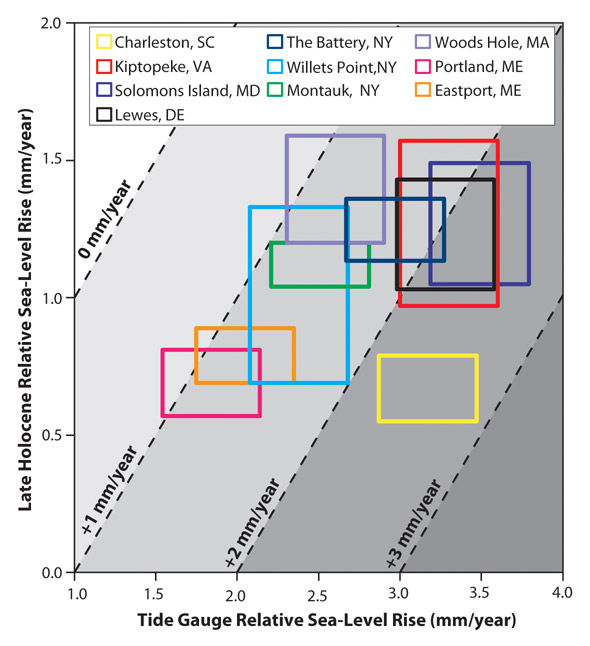
Figure 3 |Twentieth and 21st Century trends in relative sea level (RSL) from tide-gauge data compared with late Holocene (4000 years ago to AD 1900) RSL rise. Dotted lines indicate difference in rate of sea-level rise between tide-gauge and late Holocene data.
From analysis of the longest and most reliable tide-gauge records available for the U.S. Atlantic coast, the authors calculated that 20th Century rates of sea-level rise were at least 1 mm/year greater than the rate of GIA alone and more than 2 mm/year greater in Charleston, South Carolina. The average rate of sea-level rise recorded by U.S. Atlantic coast tide gauges is 1.7 mm/year greater than the background (GIA only) rate. This is very similar to the global average increase in sea level of 17±5 cm for the 20th Century that is attributed to melting of ice sheets, glaciers and the expansion of ocean water as it warms. Regional deviations from global mean sea-level rise projected for the coming decades will primarily be caused by GIA. For locations on the U.S. Atlantic coast this is a positive contribution to RSL rise that can be approximated by a linear rate and is independent of climate-driven sea level changes.
PhD
bphorton@sas.upenn.eduGlobal Challenges


