


CH2M HILL Climate Change & Innovative Urban Planning
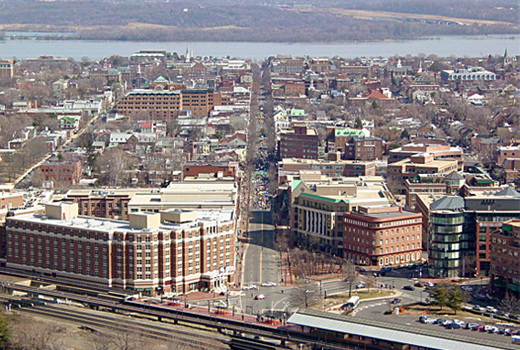
In 2009 the National Association of Clean Water Agencies and Association of Metropolitan Water Agencies reported to Congress that climate change adaptation costs could range from $448 to $944 billion for drinking water and wastewater services. Their report, Confronting Climate Change: An Early Analysis of Water and Wastewater Adaptation Costs, noted that failure to provide a timely and planned response will have serious consequences. For some cities, the challenge is already here. Virginia’s City of Alexandria, for instance, has experienced increasingly frequent flooding attributable to old infrastructure, inconsistent design criteria and intensified weather events. These conditions exist throughout the United States and elsewhere and, coupled with projected climate change impacts, are increasing the demand for innovative approaches to a changing stormwater and flood management future.
The City of Alexandria understands these changes and has responded proactively to fully incorporate projected climate change influences into their stormwater planning. As a result, the municipality retained CH2M HILL to analyze storm sewer capacity issues, to identify problem areas, to develop and prioritize solutions, and to provide support for public outreach. Their story serves as a valuable case study as the Nation adapts to climate change.
Evaluating Cost and Risk to Infrastructure
Traditionally, infrastructure needs and costs were evaluated using historical precipitation data. With climate change risk in the future, sophisticated modeling is required to assess potential changes in intensity, duration and frequency (IDF) values. IDF values are paired in this coastal town with sea level rise values and are based on results of general circulation models (GCMs) combined with a range of greenhouse gas (GHG) emissions scenarios. GCMs and GHG scenarios are modeled in a program called, “SimCLIM,” coupled with hydrology and hydraulics models developed with XP-SWMM software. This determines stormwater capacity needed today under current design, storm-based on historical values, and projected storm intensity for the year 2100.
Fortunately, the City is ahead of the curve with an innovative urban storm sewer infrastructure program incorporating a climate change risk approach. According to Alexandria’s Chief of Engineering, Maurice Daly, “Compared to other jurisdictions, we’ve been conservative in our stormwater sizing approach. Although this has helped us and reduces the anticipated costs of adapting to climate change, we still had flooding issues and recognized that we needed to evaluate whether more should be done.”
A 2008 National Oceanic and Atmospheric Administration (NOAA) Report, Unified Synthesis Product: Global Climate Impacts in the United States, cautions that very heavy storm events – those in the top 1 percent – are expected to increase by 67 percent in the Northeast United States. A broad stroke approach fills this gap by using observed data, GHG emissions scenarios and GCMs to generate site-specific temperature, precipitation and sea level rise scenarios. SimCLIM generates a daily time baseline series of future temperatures and precipitation, as well as rainfall return frequencies and amounts. This can be used to generate various scenarios for agricultural, water resources and coastal impacts, as well as sea level change.
The project team reviewed Alexandria’s stormwater design criteria and updated the City’s IDF curves using longer historical climate data, comparing it to those derived from climate change scenarios. To evaluate climate change adaptation options, the IDF curves became input for new City hydrologic and hydraulic models of the storm sewer infrastructure. These models will be used to determine cost and risk for different mitigation scenarios and assumptions for rain design storms and sea level rise in 2050 and 2100.
A pilot watershed analysis is complete. And, revised design criteria for storm IDF curves and sea level rise hydraulic boundary conditions will be recommended and applied to develop a citywide storm sewer master plan.
Setting the Groundwork – A Defendable Methodology
Results from five GCMs (low, medium and high GHG emissions scenarios) were used to generate projected changes in monthly and annual precipitation for the years 2050 and 2100. These projections were then applied to the historical daily precipitation record for the period 1948 to 2008 to produce updated IDF values for durations ranging from 5 minutes to 96 hours, with return intervals ranging from 2 to 500 years.
The SimCLIM modeling tool was used to merge historical climate information with global climate change projections. In this case, projections were aggregated to annual totals. In the 1990s, annual precipitation was just below 42 inches per year. With a low GHG emissions scenario, rainfall increases by 2050 to slightly more than 42 inches per year. However, under a high GHG emissions scenario, the 2050 projection is 45 inches per year and the 2100 projection is nearly 50 inches per year. In terms of infrastructure needs, this is comparable to moving the City of San Diego, in dry, southern California, north to Sacramento, which gets 8 inches more rain per year.
Click to View Larger Image – © CH2M HILL | Projected Changes in Annual Precipitation for Ronald Reagan
Washington National Airport Using the Median of Five GCMs and
Three Emission Scenarios for the Years 1990 to 2100
GCM results are produced at a coarse resolution (100 to 200 kilometers) and must be downscaled to capture local climate characteristics. Statistical downscaling (pattern scaling) is a two-step process involving development of statistical relationships between local climate variables and large-scale predictors, and applying these relationships to GCM output to simulate local climate characteristics. The SimCLIM application creates one kilometer monthly projected “climate surfaces” using historical monthly average climate elements.
Projecting Extreme Storm Events
Past climate data can be queried through an extreme event analysis tool that determines probability of a particular extreme event (such as heavy rainfall). SimCLIM uses the generalized extreme value statistical analysis methodology to model extremes of natural phenomena. The differences between monthly projected precipitation values and average monthly precipitation from the historical base period (1948 to 2008) were determined. The percent difference was prorated and applied to daily precipitation values for the selected period. This analysis was particularly important to the City of Alexandria, which was already under flooding pressure.
The project team found that a relationship exists between annual precipitation and intensity – a conclusion supported by other research. Historically, a storm that would produce 8 inches of rain in a 24-hour period would be expected to occur every 100 years. Under a low emissions scenario, the recurrence interval for that type storm is projected to increase to every 50 years. Assuming high GHG emissions into the future, the recurrence interval is projected at every 20 years.
Click to View Larger Image – © CH2M HILL | Illustration of projected changes in return period (in years) for the 24-hour precipitation using observed daily precipitation (1948-2008), ensemble projections for 2100 from five GCMs and three emissions scenarios.
Potential for Sea Level Rise
Projected changes in mean sea level and mean higher high water were generated using SimCLIM for the same five GCMs and three GHG emissions scenarios applied throughout the study. Historical data came from the Washington D.C. gauge near the City of Alexandria. Projected mean sea level rise from the five scenarios ranges from 1.76 to 2.44 feet elevation (North American Vertical Datum) by the year 2100. The projected mean higher high water sea level rise ranges from 3.35 to 4.05 feet elevation by the year 2100. Surface elevations along Old Town, Alexandria’s waterfront, are at 3.2 feet elevation.
Review of relevant sea level rise literature for the Chesapeake Bay area indicated a sea level rise range by 2100 of 2.7 to 3.4 feet in one study and from 1.6 to 4.6 feet in another study, so the literature generally corroborates projections developed in the Alexandria study. Therefore, CH2M HILL recommended that future infrastructure planning account for possible sea level rise increases of between 3.3 and 4.0 feet for mean higher high water, in addition to water levels projected due to storm surge and flood flows in the Potomac River.
Click to View Larger Image – © CH2M HILL | SimCLIM Derived Projection of Mean Higher High Water Levels (1990-2100) Relative to Observed Historic Values and Trend (1978-2008) at Washington, D.C.
Integrating Results with Smart Urban Planning
To achieve effective storm sewer planning and design, the City of Alexandria’s approach integrates historical precipitation IDF analysis with GCM projections and projected sea level rise. Because of potential infrastructure cost implications of changing drainage design criteria, it was recommended the City initially adopt the NOAA Atlas 14 or L-Moment results, which are generally lower than the City’s current IDF curves, but based on a much more complete historical data set and statistical analysis.
As part of the pilot watershed analysis of drainage facility needs, the City will analyze costs and risks associated with lower NOAA curves compared with higher projected 2100 IDF curves (and sea level rise impacts on downstream hydraulic constraints). When costs of stormwater management improvements are weighed against risks of either reducing IDF curves (by using NOAA Atlas 14) or increasing IDF curves (using projected 2100 rainfall intensities), the City will have a better understanding of the implications of changing their design criteria.
“These tools allow us to make site-specific determinations quickly and easily. We can do the analysis instead of making a broad assumption, and then make defensible planning decisions based on the outcomes,” said Daly.
Because the City of Alexandria already has conservative design criteria for stormwater and infrastructure systems, climate change projections won’t require significant changes to their baseline design standards. For Alexandria, they indicate changes up to 50 percent from the IDF baseline. However, because their current infrastructure is already constructed to a higher baseline standard, the City is only contemplating infrastructure changes in the 8 to 15 percent range. This is more fiscally manageable than what many cities are facing, and a relief for the citizens of Alexandria.
Water Resources Engineer
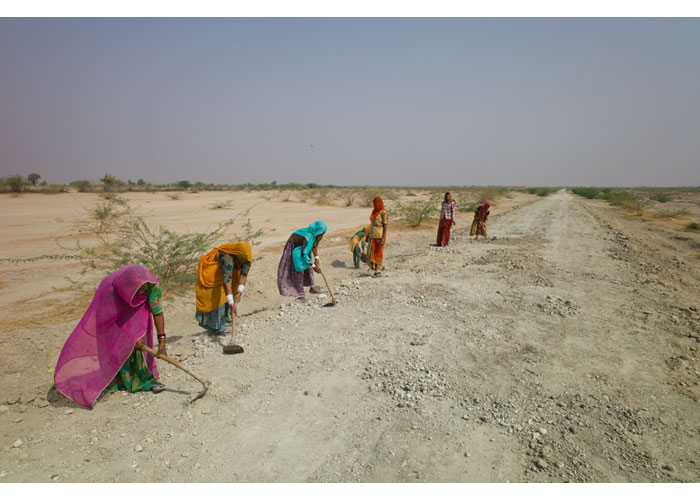
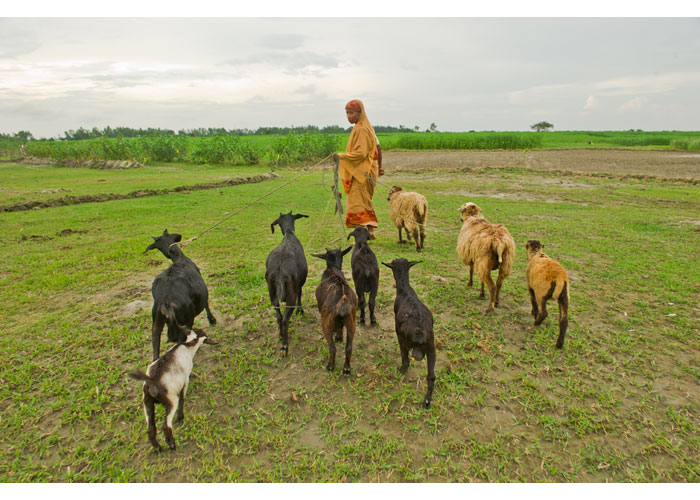
Global Challenges


