


HDR & SROI How to Measure “Green”
The prolonged economic downturn has increased pressure on municipalities to do more with less. The Obama Administration is attempting to solve this problem and transform the economy through “green” investment in infrastructure, energy and climate initiatives. However, the challenge is balancing trillions of dollars in local infrastructure needs with severely limited Federal funds. Future funding is more likely to flow through competitive grant processes that reward initiatives making a “green” business case. Examples of early selection criteria include: the project‘s leverage potential, legacy benefits, jobs – whether “green” or “grey” (traditional) – energy and greenhouse gas emissions, as well as return on investment (ROI).
But, how does one best make a “green” business case? Traditionally, infrastructure projects have been viewed as providing a needed service or function. More recently, they have been viewed for their ROI in financial terms. What‘s needed now is a better way to measure the “triple bottom line” of economic, social and environmental costs and benefits.
Determining a project‘s Sustainable Return on Investment, or SROI, provides the necessary metrics.
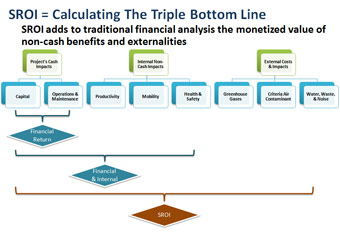
Fig. 1 – © HDR, inc.
It weighs the full range of social, environmental and economic benefits against costs and incorporates risk assessment in projects as varied as roadways and water treatment plants (Fig. 1). Another critical element of the SROI framework is to keep stakeholders engaged throughout the process – to validate the planned structure and logic of the analysis as well as the variable inputs. By building consensus, the credibility of projected outcomes is strengthened.
Calculating SROI means examining a broad range of project attributes and turning them into measurable monetary inputs. Examples of traditional inputs include: savings on utility bills, reduced operations and reduced maintenance costs. Examples of sustainable inputs include: monetizing environmental savings from reduced carbon emissions and fewer sick days taken by employees working in green buildings. These type potential costs and benefits become sustainability measures while simultaneously incorporating a risk/probability analysis component during the project‘s life cycle.
From FROI to SROI
Many project feasibility studies cover life-cycle costs including capital, operations and maintenance as well as commissioning and decommissioning costs. These outcomes are stated in financial terms only. SROI includes the direct cash benefits of a financial analysis but also the objective analysis of the present value of non-cash and external costs and benefits from a social and environmental perspective associated with the endeavor.
Funding agencies will want metrics on the probability that specific outcomes will be achieved, so projections should identify likely results at 10 percent, 50 percent and 90 percent confidence levels. The “green” business case should also identify the most significant overall risk factors, including probability distributions for each major element. It should describe the plan for risk allocation between stakeholders, for risks to others, for risks that can and cannot be mitigated and the present value impacts associated with those risks.
How SROI Compares to Traditional ROI
Traditional models such as life-cycle cost analysis (LCCA) fall short in justifying sustainable decisions because they only consider cash impacts, lack transparency and do not account for uncertainty. LCCA incorporates changes to direct cash flows over a project‘s entire life cycle. These include initial capital expenditures and replacement capital, changes to annual operations and maintenance expenses, such as utility bills, and decommissioning costs. These impacts are then adjusted for the time value of money to measure the financial return on investment (FROI).
SROI uses these measurements as well, but takes them a few steps further. It adds the monetized value of non-cash benefits, such as changes in greenhouse gas and air contaminant emissions, health and safety effects, water saved and worker productivity.
The following decision metrics are used for both SROI and FROI:
- Net Present Value (NPV) The net value of an investment, calculated as benefits less costs, with both expressed in present value monetary terms.
- Return on Investment (ROI) The ratio of the net value of an investment relative to the cost of the investment.
- Discounted Payback Period (DPP) The period of time required for the discounted return on an investment to recover the sum of the original investment.
- Internal Rate of Return (IRR) The discount rate at which the net present value of a project would be zero.
- Benefit to Cost Ratio (BCR) The overall “value for money” of a project, expressed as the ratio of the benefits of a project relative to its costs, with both expressed in present-value monetary terms.
The Four-Step SROI Process
The SROI methodology employs a four-step process. It includes developing the structure and logic, quantifying the input data and assumptions, holding a risk analysis session with stakeholders and simulating the model results.
Step 1 – Developing Structure and Logic Diagram
The structure and logic diagram illustrates the main cost and service level areas to be considered in the risk analysis. The structure and logic diagram depicts the benefit-cost methodology non-mathematically, thus indicating how all variables and assumptions combine to produce a forecast. In addition to providing detailed documentation of how cost and cost-avoidance methodologies are characterized for the risk analysis, the structure and logic diagram provides a clear and uncomplicated means of explaining cost and service-level categories to outside experts and stakeholders, regardless of their familiarity with mathematical modeling techniques.
Step 2 – Quantifying the Input Data and Assumptions
At its core, the SROI process uses a mathematical model to analyze probabilities associated with environmental, social and economic values produced by a project. During this step, each of the variables selected when developing the structure and logic model is assigned a central estimate and range (probability distribution) to represent the degree of uncertainty. Special data sheets are used to record the estimates. The greater the uncertainty associated with a forecast variable, the wider the range will be. This process ensures that risks are properly reflected in the forecasting process.
An Example of Determining a Social Value: Monetizing a Ton of CO2
As with all inputs used in its studies, HDR uses a probability distribution to represent the potential value for a ton of CO2 (in this case a PERT distribution was used). Defining the PERT distribution requires three key data points: an expected median or 50th percentile value, a low value representing the minimum realistic value and a high value representing the highest realistic value. In order to determine which would be the most appropriate data point, a meta-analysis of over 200 recent scientific estimates of the social cost of CO2 was conducted. For the upper and lower bounds, HDR economists used two well-established yet extreme views of the theoretical impact on the planet of an incremental ton of CO2. The median value was generated under the auspices of several U.S. Federal departments to assist agencies in regulatory impact analysis:
- Lower: $7.43/Metric Ton in 2005$ (Source: William D. Nordhaus, A Question of Balance: Weighing the Options on Global Warming Policies, 2008, Table 5-4)
- Median: $21.40/Metric Ton in 2007$ (Source: Federal Interagency Working Group on Social Cost of Carbon (IWGSCC), 2010)
- Upper: $85.56/Metric Ton in 2005$ (Source: Nicholas Stern, The Economics of Climate Change: The Stern Review, 2006)
These values are based on the calculation of expected damage caused by climate change, including not only impacts on market outputs like food and forestry, but also estimates of losses from non-market impacts. The most comprehensive damage studies include such factors as greater intensity of hurricanes, impacts of changes in temperature and precipitation on food production, ecosystem services, recreation and increased burdens of disease. The estimates also include adjustments for the risk of low-probability, high-consequence events, such as abrupt climate change. The primary difference between these estimates is in the discount rate used to value future impacts.
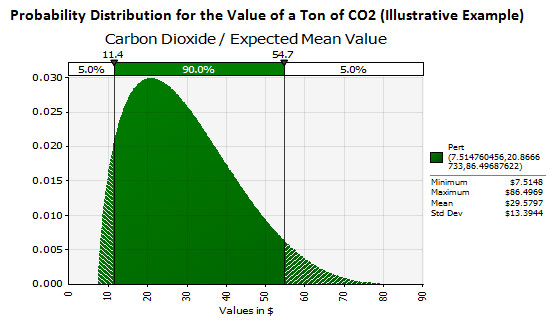
Fig. 2 – © HDR, inc
After the aforementioned numbers are adjusted for inflation to 2011$ and converted to a short ton, the lower, median and upper values become $7.51, $20.87 and $86.50 respectively. Using these three values with a PERT distribution results in an expected mean price of $29.58/short ton (Fig. 2). This value is then escalated annually using rates derived from the Federal Interagency Working Group on Social Cost of Carbon.
Ranges need not be normal or symmetrical. In other words, there is no need to assume the bell-shaped normal probability curve. The bell curve assumes an equal likelihood of being too low or too high in forecasting a particular value. Risk analysis places little restriction on the degree of skew in the specified ranges and thus maximizes the realism of the model. Probability ranges are established on the basis of both statistical analysis and subjective probability. Factors considered in the analysis include:
- Historical behavior of the variables;
- National economic forecasts and events;
- Regional and local economic and demographic forecasts, and nature of the local economy;
- Allowance for immediate issues (such as oil price fluctuations, interest and exchange rates); and
- Factors identified in the risk assessment.
Although the computer program will transform all ranges into formal probability density functions, they do not have to be determined or presented in either mathematical or graphical form. All that is required is entry of upper and lower level limits of an 80 percent confidence interval in the data sheets. The risk analysis software will then use numerical analysis to automatically translate these entries into a uniquely defined statistical probability distribution. This allows administrators, stakeholders and decision-makers who do not have formal statistical training to understand and participate in the process.
Step 3 – Risk Analysis Session to Facilitate, Critique and Develop Consensus
This step includes revision of estimates and ranges developed in Step 2, if necessary.
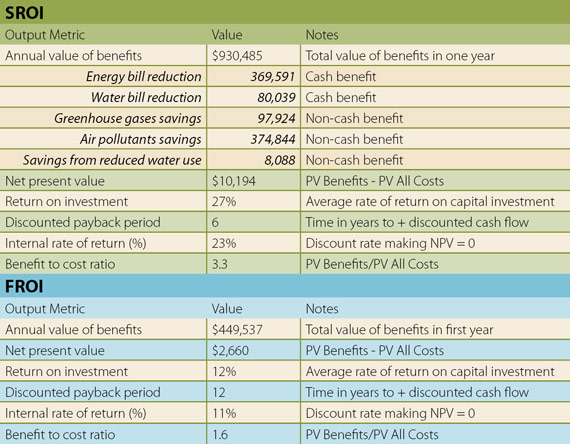
Fig. 3 – © HDR, inc.
In this step economists discuss principal assumptions and values used in the structure and logic models with stakeholders and independent experts (if indicated) during a structured workshop. This step gives session participants a final chance to critique or question values used in the structure and logic models. For example, the risk analysis group for a nationally known medical center (Fig. 3) included a project team, technical specialists, economists, outside experts, public agency officials and a facilitator.
When necessary, changes are made to either the structure and logic models or the data sheets. Changes may include adding or removing variables or simply changing numbers in data sheets. The purpose is to ensure that prior to turning the structure and logic models into risk analysis forecasting software, the models reflect reality, and the results reflect the collective vision of workshop session participants.
Step 4 – Simulate the Model Results
After the models and data inputs are finalized, the risk analysis software transforms ranges given in the data sheets to statistical probability distributions. Monte Carlo simulation techniques combine these distributions, letting all variables vary simultaneously from their expected values according to their defined probability distributions.
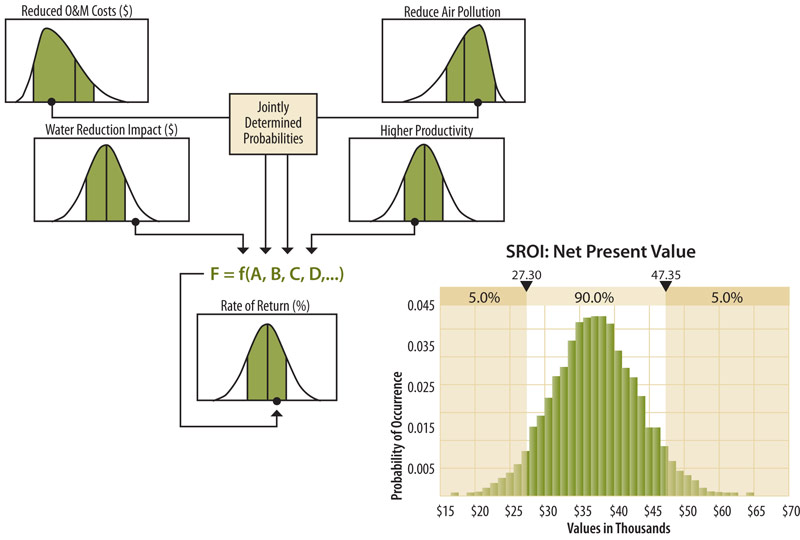
Fig. 4 – © HDR, inc.
The result is a cost forecast that includes estimates of the probability of achieving alternate outcomes. Each output is displayed as a graph. Distributions (Fig. 4) are shown for reduced operations and maintenance costs, indoor air pollution and water use, and higher productivity for the medical facility example. The savings from reduced water and energy use are cash benefits; the air pollutant and greenhouse gas reductions are non-cash benefits.
The SROI medical center analysis also included summaries of financial metrics from both a SROI and FROI perspective as shown in Figure 3. In this example, the benefit-to-cost ratio of SROI is 3.3 compared to 1.6 with traditional FROI. The most significant savings come from reduced air pollutants. Figure 5 is a summary of results, which give decision-makers a clear visualization of how integrating environmental, economic and social variables, along with their respective probability distributions, impacts project valuation.
The financial curve, shown in blue, illustrates the traditional financial approach that only factors in revenue and expenses. The difference between the curves is the value of “green.”
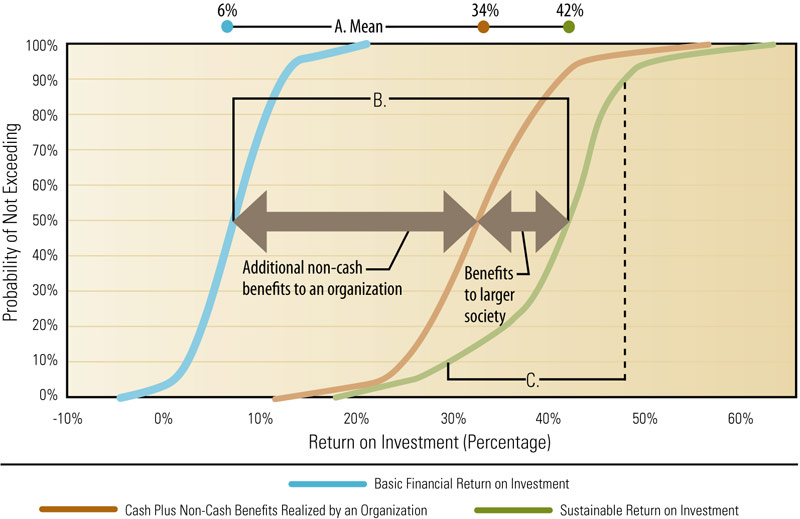
Fig. 5 – © HDR, inc.
In this example from the research university, the mean sustainable return on investment is substantially greater than the financial return on investment. The statistical likelihood that the return will fall within an 80 percent confidence level in this example ranges from six percent to 16 percent for FROI and 34 percent to 53 percent for SROI when counting non-cash and external benefits associated with this particular proposal.
HDR Track Record
Within the past few years, this SROI methodology has been applied in a number of settings, including municipal, county, state and Federal governments; the utility industry; transportation/railroad initiatives and on behalf of major academic institutions. The aggregate project value of more than 20 assignments is in the billions. Clients include: the city of Boston, the state of California, Johns Hopkins University and the U.S. Army.
Cost of Deploying SROI Methodology
While the SROI process is more detailed and involved than LCCA and FROI analysis, the cost of application is not significantly more than these traditional techniques. Experienced process facilitators should have access to information needed to construct the initial structure and logic diagrams, and to supply preliminary data input. This information will provide an understanding of how to efficiently undertake the validation and scenario modeling process. SROI can be used to craft “green” business cases for individual projects, capital programs and a broad range of initiatives with the analysis cost between $25,000 and $35,000. This cost increases relative to complexity of undertaking, number of alternatives examined and availability of data. Examples of larger projects involving more than $1 billion in capital investment featured SROI analysis costing approximately $150,000. Note that these costs often include the base LCCA and FROI analysis generally incorporated in traditional feasibility studies. One railroad capacity improvement program located in California used SROI to create a “green” business case to successfully secure a state grant of $200 million to support the program in 2008.
Conclusion
Because the concept of sustainability still lacks general consensus, it has been difficult to incorporate into project valuations. The missing piece has been an objective, transparent process that can demonstrate how sustainable projects will generate economic growth while conserving limited resources. The SROI framework provides that process and allows public officials to express, in dollar terms, non-cash costs and external benefits. It has been proven in a range of settings and project scales. It combines best practices in cost-benefit analysis, risk analysis and collaborative consultation.

© iStockphoto.com/raalves
More and more grant applicants will see requirements from Federal funding agencies demanding details associated with a “green” business case. Proof of this assumption is found in the October 5, 2009 Executive Order 13514 issued by President Obama entitled, “Federal Leadership in Environmental, Energy, and Economic Performance.” The President specifically orders Federal agencies to comply with detailed policy and goals. The Order states that “agencies shall prioritize actions based on a full accounting of both economic and social benefits and costs, and shall drive continuous improvement by annually evaluating performance, extending or expanding projects that have net benefits, and reassessing or discontinuing under-performing projects.”
There are also emerging signs at the state level of discretionary funding programs placing emphasis on competitive processes that make transparent cases for sustainability. Recent proposals for infrastructure investment banks are also emphasizing transparency and objective project evaluations. The SROI framework allows public officials to comply with emerging Federal and state requirements while justifying their expenditures in sustainable initiatives to stakeholders, articulating the merits of proposed initiatives to funding agencies and building confidence in their commitment to sustainability.
Learn more at http://hdrsroi.com.
Global Challenges